
"Many people conflate or confuse complexity with being complicated. Complexity needn't be complicated," writes Analytics Consultant Richard Davey
Utilities companies such as water, electricity and gas networks operate in incredibly complex environments. In my time with Arcadis Gen, I've seen many diverse reactions from clients in the face of such complexity:
"I don't have enough data to begin analyzing my system."
"I'm drinking from a fire hydrant! It's not possible to keep pace with my newly acquired data"
"It's too difficult to make data-driven decisions because it's all too complicated."
I will refer to these as the "Three Stages of Data Grief". In the face of complexity, many companies find themselves overwhelmed and, understandably, unsure of how to properly deal with these. The problem is that incorrect measures and tools end up exacerbating the situation, heavily costing the company in time and resources. In this article, I will be delving into these stages of data grief in the hopes of helping demystify the process of data analytics.

Data Grief
Data Grief is when a company is unable to process its data and incur losses as a result.
Many organizations experiencing data grief resort to using highly sophisticated analysis models, assuming that this can do the bulk of the work for them. While this is true, in theory, the problem is that most market-available analytics tools are designed for enterprise-level action, and the average organization's data actually ends up being too simple for the software. This brings us to reaction #1:"I don't have enough data." So now, authorization is given to collect more data. Grief #2 happens: "I can't keep pace with my data." Then the company devotes time to gathering and organizing its warehouse of data, which is usually when stage 3 happens: "It's too difficult to make sense of my data!"
I have a hunch that some of these issues happen because many people—particularly those in charge of making company decisions—conflate or confuse complexity with being complicated. Complexity needn't be complicated; they are not the same thing. Complex is a description of the system in which a company operations; it's something you generally can't control. Whereas "complicated" refers to the analytical approach a company might take—and how complicated your analysis might be is very much within your control.
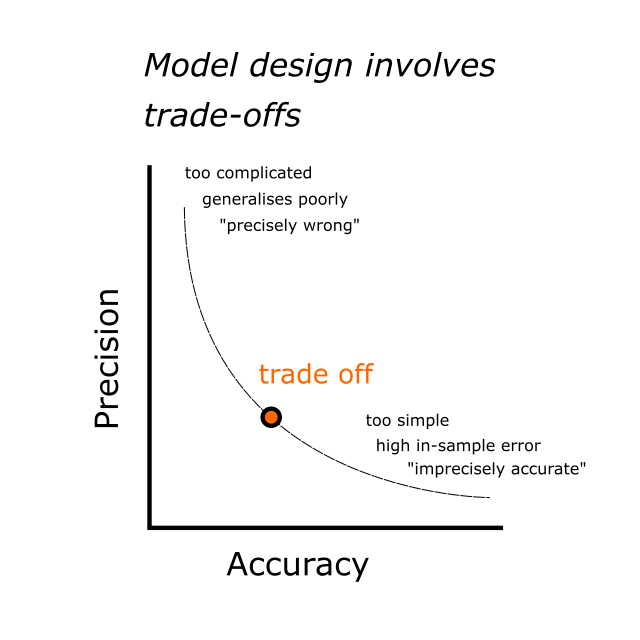
"But surely, you need a complicated model to understand a complex system?" Turns out, this is frequently not the case. Ironically, understanding a complex system becomes easier when using a simple model to interpret it. Here at Arcadis Gen, we're very aware of the trade-offs that have to be made when modelling. On one extreme, it is possible to build a complicated and highly specific model, but it tends to make inaccurate predictions because it does not generalize in the real world. On the other hand, you can make a simple model that is easily understood even by non-subject matter experts and can make accurate predictions, but lacks the precision to ultimately be useful. If you were to gauge an asset effective age on the first model, you may come up with a precise but incorrect answer of 1000.1338273 years. With the second model, it may give you a range of 0 to 80 years, which is accurate, but imprecise. The sweet spot then lies somewhere in between where a model is understandable and defendable, yet yields insights into the dominant causal relationships at work.
Let's look at some real world examples to illustrate. To tackle the first stage of data grief (a.k.a., not enough data), Arcadis Gen will often work with the company to draw out information from their subject matter experts. For instance, we've built a web app that can construct Weibull deterioration curves for infrastructure assets based solely on a questionnaire. For road fleet modeling, we used open data from the UK Driver Vehicle Licensing Authority to augment information on individual vehicles. We also used new car registration data from the Vehicle Certification Agency to build predictive models to infill missing values based on trends. In this case, even though individual organizations may not have sufficient data on their own, we could readily augment this by tapping into outside sources.
Now we go to the next stage—what happens if you have too much data, then? Data is everywhere so it follows that the more you tap into sources of data, the more you will naturally get. In this case, you need to narrow down your search field. Keep it simple—what exactly are you looking for? What problems do you hope to address? Arcadis Gen frequently works with clients to make the business problem as simple as possible. When we worked with an electricity generator to optimize the maintenance of their auxiliary plant, we ended up with enough data to model every single year each and every asset could be replaced and refurbished. It was quite the tempting dilemma, indeed!
But if we had utilized every single information available to us, we would have significantly broadened the scope to include modeling all the things that made each individual asset unique (like asset condition monitoring data, work orders, etc.). We would have jumped to grief #3: being overwhelmed by the sheer volume of data and not knowing how to make sense of it. The problem was simple: what was the optimum replacement and refurbishment schedule frequency to apply to the whole asset class, not every single component. Doing it collectively made it easier to defend and explain to asset managers—the people who would ultimately be making the decisions. Our purpose was to persuade these stakeholders to take action from the results, and as tempting as it would be to go above and beyond, ultimately your first (and only) priority will be to answer the problem at hand.
Clearly define what the problem is, and look only for the most relevant bits of information. This way, you don't end up compiling heaps and heaps of data, because you'll easily know when you have enough.
But there are times when problems refuse to be simplified, and you wind up in the final state of data grief anyway—things got too complicated. In this case, if you are unable to simplify the analysis itself, you break down the visualization and reporting aspect instead. Your stakeholders need to understand the data as they are the ones who will ultimately call the shots. If the decisions they make are based on inaccurate, incomplete, or downright incorrect information, it could be detrimental to the project or the company. This might also be the time to bring in the experts in order to prevent any costly mistakes from happening.
Arcadis Gen once worked with a UK water company who was struggling with a freshwater distribution network. There was simply no way the complex system could be reduced to a simple model. We developed a real-time water supply and demand tool called WiSDM-O, which takes SCADA data from pumping stations and predicts future demand and stored water volumes. The technicalities were still too complicated, so we determined only the parts that senior management needed to know (in other words, the ones that have bearing to their decision-making), developed a set of high level dashboards with all the key metrics they'll need to inform their strategies, and presented that. At the end of the day, management really only needs a handful of information to proceed with their decisions—no need to present the entire project and lead them to stage #2 of data grief: too much information.
Conclusion
Whatever data grief you are experiencing, we're happy to help make the complex uncomplicated.
This is precisely why we developed Universal Visual Optimizer (UVO). Most data analytics tools and software available on the market are designed for enterprise-level companies—organizations who deal with hundreds of thousands of data, for such large-scale implementations, at any given time. For smaller company handling smaller amounts of data, and not always with the help of data scientists and experts, UVO is the perfect solution for you. It is a bite-sized analytics tool that gives you all the advantages of traditional advanced analytics solutions but cheaper, simpler, designed with the average business user in mind.
UVO lets you process your data for you, saving you from data grief. To learn more about this, get the full fact sheet or book a demo today.

Did you find this information useful?
Did you find this information useful?
Thank you for your feedback!